


Market Structure & Dominance Analysis – July 15
💸 Where’s the Money Flowing?
Market Structure & Dominance Analysis – July 15
Hey everyone!
Today, we’re analyzing key market indexes to understand where the money is moving.
We also had inflation news recently — but it didn’t make any major impact on the market.
---
📌 BTC/USDT
🔹 In the short term, BTC needs to break above 118,200 to continue the uptrend.
🔹 A correction toward 110,000 is possible.
❗️If price falls below 110,000, we should start considering a trend change and short setups.
🟢 115,000 remains a key support for now.
---
💧 USDT Dominance (USDT.D)
📊 These levels are crucial to watch: 4.44, 4.36, and 4.22
⬆️ Break above 4.44 ➤ Bearish for the market. Sign of more selling pressure.
⬇️ Break below 4.36 ➤ First sign that Bitcoin and altcoins may be finishing their correction or sideways range.
⬇️ Break below 4.22 ➤ Strong confirmation of bullish continuation across the market.
---
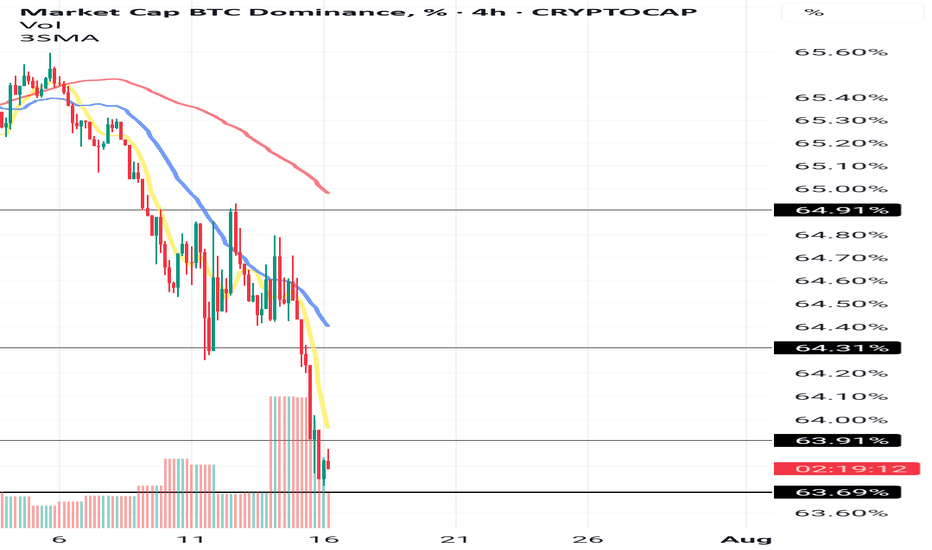
🟠 BTC Dominance (BTC.D)
🔻 Levels 63.31 and 63.91 were broken to the downside.
This suggests capital is rotating out of BTC — and possibly into altcoins or stablecoins (like USDT).
⚠️ Next levels to watch: 63.7 and 63.5
✅ If BTC.D continues to drop and at the same time:
TOTAL2,
TOTAL3,
and OTHERS.D are rising...
Then we can start looking for entry triggers in:
ETH
Top 10 alts
or even coins ranked 10–100, especially those bullish vs BTC pair.
These can become great entry points during market rotation.
---
📈 TOTAL Market Cap
Still bullish. Currently testing 3.58T and 3.78T levels.
🔹 Break above 3.78T = Entry trigger.
✅ As long as we hold above 3.58T, it's a sign to keep long positions open.
---
📈 TOTAL2 (Altcoin Market Cap w/o BTC)
Also bullish, facing resistance at 1.26T and 1.34T
🔹 Break above 1.34T = Strong entry signal.
✅ Holding above 1.26T confirms bullish structure and supports long positions.
---
🟢 OTHERS Dominance (OTHERS.D)
Yesterday, we saw a break above 7.60%, which explains the stronger performance in some coins ranked 10–100.
---
✅ Conclusion
If BTC.D continues to drop, look for BTC-paired coins that are showing strength.
💡 If those coins also break key USDT levels, they could be solid long setups.
📌 Bitcoin’s HWC (Daily) and MWC (4H) structures remain bullish as long as we stay above 110,000.
However, LWC (1H) is still ranging with a slight bearish bias.
---
🙏 If this analysis helped, don’t forget to hit the 🚀 icon and follow for more updates!
source https://www.tradingview.com/chart/BTC.D/XeDaCeUO-Market-Structure-Dominance-Analysis-July-15/
source https://www.cryptomadden.com/2025/07/market-structure-dominance-analysis.html
No comments:
Post a Comment